
Pervious Pavement Case Study
University of New Hampshire Stormwater Center — 2019
Triverus’ high-efficiency surface cleaning technology has the ability to remove critical stormwater pollutants from impervious surfaces and restore the functionality of pervious and porous surfaces. In 2019, an independent third party — the University of New Hampshire Stormwater Center (UNHSC) — sought to quantify the capabilities of Triverus’ cleaning technology.
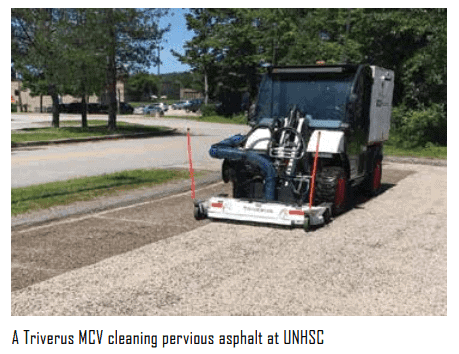
A series of surface infiltration tests were conducted on pervious pavements at the UNH campus in Durham, New Hampshire. Tests were performed using ASTM C1701 Standard Test Method for Infiltration Rate of In Place Pervious Concrete — the industry standard for measuring pervious surface performance. Measurements were taken before and after cleaning with a Triverus Municipal Cleaning Vehicle (MCV), a commercially available vehicle integrating Triverus 3,800 PSI spray cleaning and recovery technology on a Bobcat® Toolcat™ all-wheel steer carrier.
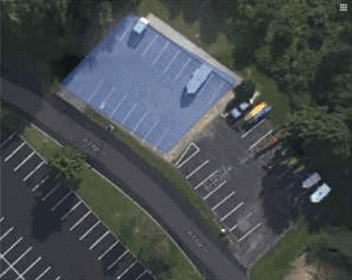
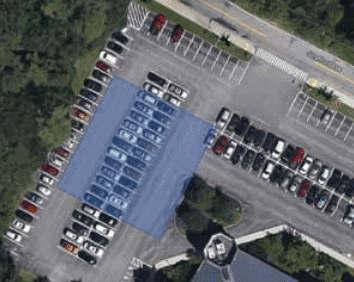
Two locations were identified for detailed testing: the West Edge porous asphalt lot and the Elliot Alumni Center porous asphalt lot, both on the UNH campus.

| Parameter | Value |
|---|---|
| High Temperature | 79 °F |
| Low Temperature | 57 °F |
| Day Average Temperature | 69.29 °F |
| Precipitation (past 24 hours from 04:56:00) | 0.00 in |
| Dew Point | 52.33 °F |
| High Dew Point | 56 °F |
| Low Dew Point | 49 °F |
| Average Dew Point | 49 °F |
| Maximum Wind Speed | 10 mph |
| Visibility | 10 mi |
West Edge Porous Asphalt Lot
Built in 2005, the West Edge porous asphalt lot was 14 years old at the time of testing and had received maintenance for at least the first five years of operation. Since 2010, minimal maintenance had taken place. The area is approximately 5,000 square feet and had an average pre-cleaning infiltration rate of 3 in./hr. — well below the 10 in./hr. threshold required for hydraulic functionality. The lot was cleaned on July 8, 2019.
Elliot Alumni Center Porous Asphalt Lot
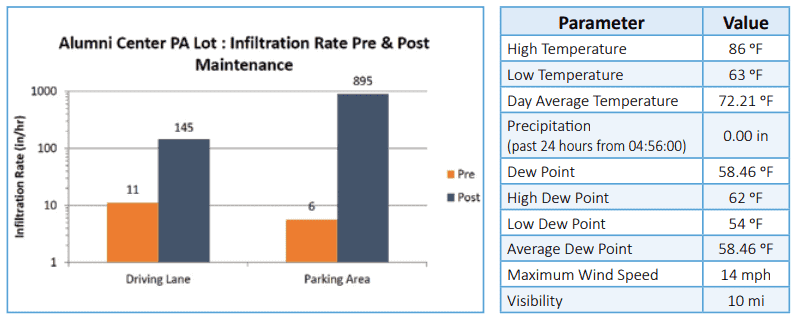
Built in 2012, the Alumni Center lot was seven years old at time of testing. It received maintenance for approximately the first two years of operation; no effective maintenance appeared to have occurred since 2014. At approximately 50,000 square feet, it was substantially larger than the West Edge site. A small 2015 test by UNHSC staff confirmed restoration potential but demonstrated the limitations of manual cleaning at scale — restoring two 200 sq. ft. test areas took two staff approximately two hours each, projecting to ~125 hours for the full site. The MCV restored the full lot in approximately 4 hours. The lot was cleaned on July 10, 2019.
| Parameter | Value |
|---|---|
| High Temperature | 86 °F |
| Low Temperature | 63 °F |
| Day Average Temperature | 72.21 °F |
| Precipitation (past 24 hours from 04:56:00) | 0.00 in |
| Dew Point | 58.46 °F |
| High Dew Point | 62 °F |
| Low Dew Point | 54 °F |
| Average Dew Point | 58.46 °F |
| Maximum Wind Speed | 14 mph |
| Visibility | 10 mi |
Cleaning and Testing
During cleaning at both sites, material was removed from the pervious surfaces by the Triverus MCV and was separated and saved for testing. The water used and recovered during the cleaning process was also saved for analysis. Coarse solids were weighed and samples collected for laboratory testing. Grab samples of the water slurry were taken and sent as a composite sample for laboratory analysis.
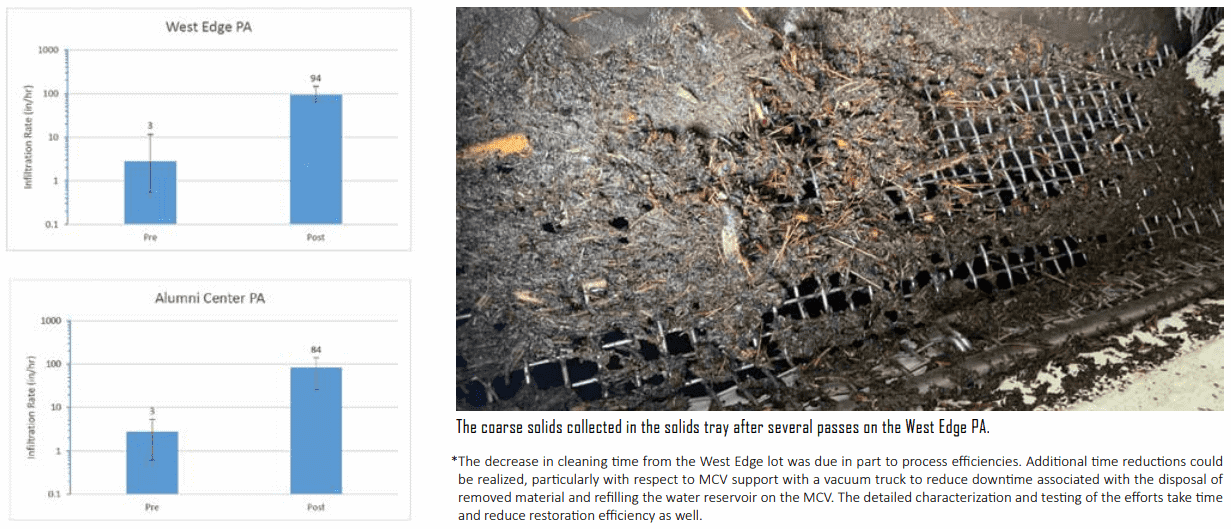
The restoration process was inevitably longer and more time-intensive than typical routine maintenance, but produced dramatic performance increases. The average post-cleaning infiltration rate for the West Edge lot was 94 in./hr. — functionally restored from 3 in./hr. Cleaning took approximately 6 hours and removed 150 lbs. of coarse sediment. The average post-cleaning rate for the Alumni Center lot was 84 in./hr. — functionally restored from a failed state. Cleaning took approximately 4 hours and removed 350 lbs. of coarse sediment.
*The decrease in cleaning time from the West Edge lot was due in part to process efficiencies. Additional time reductions could be realized, particularly with respect to MCV support with a vacuum truck to reduce downtime associated with the disposal of removed material and refilling the water reservoir on the MCV. The detailed characterization and testing of the efforts take time and reduce restoration efficiency as well.
Results — Infiltration Restoration and Pollutant Removal
The restoration effort was extremely successful at both sites. UNHSC’s research supports further exploration of restoration activities followed by routine operation and maintenance — vacuum sweeping twice per year — to prevent reclogging. The data also reveals significant differences in pollutant partitioning between the liquid and solid fractions of the removed materials, underscoring the importance of properly treating the recovered waste, particularly in nitrogen-sensitive areas.
Pollutant Removal Data
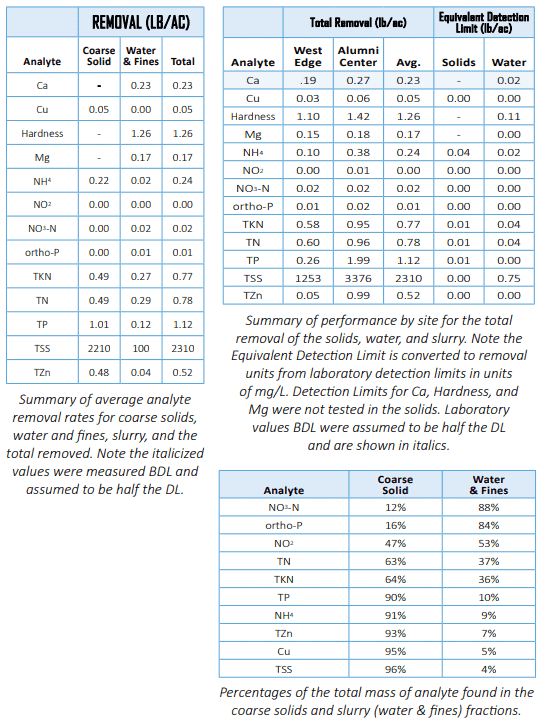
| Analyte | Coarse Solid | Water & Fines |
|---|---|---|
| NO₃-N | 12% | 88% |
| ortho-P | 16% | 84% |
| NO₂⁻ | 47% | 53% |
| TN (Total Nitrogen) | 63% | 37% |
| TKN | 64% | 36% |
| TP (Total Phosphorus) | 90% | 10% |
| NH₄⁺ (Ammonium) | 91% | 9% |
| TZn (Total Zinc) | 93% | 7% |
| Cu (Copper) | 95% | 5% |
| TSS (Total Suspended Solids) | 96% | 4% |
Most pollutants, especially metals, phosphorus, and suspended solids, are captured in the coarse solid fraction, making proper solid waste disposal the primary compliance consideration.
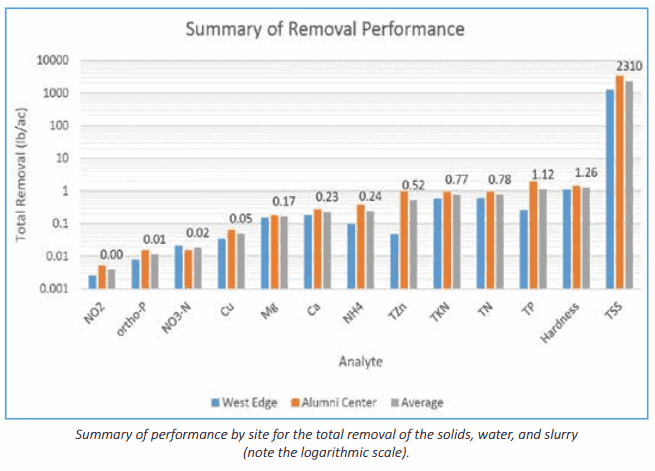
Summary of performance by site for the total removal of solids, water, and slurry. Note the logarithmic scale. The TSS values (2,310 lb/ac average) dwarf all other analytes on an absolute basis, confirming that the solid fraction is the dominant carrier of pollutant load from pervious pavement surfaces.
Analyte Removal and Partitioning Data
| Analyte | Coarse Solid | Water & Fines | Total |
|---|---|---|---|
| Ca | – | 0.23 | 0.23 |
| Cu | 0.05 | 0.00 | 0.05 |
| Hardness | – | 1.26 | 1.26 |
| Mg | – | 0.17 | 0.17 |
| NH₄ | 0.22 | 0.02 | 0.24 |
| NO₂ | 0.00 | 0.00 | 0.00 |
| NO₃-N | 0.00 | 0.02 | 0.02 |
| ortho-P | 0.00 | 0.01 | 0.01 |
| TKN | 0.49 | 0.27 | 0.77 |
| TN | 0.49 | 0.29 | 0.78 |
| TP | 1.01 | 0.12 | 1.12 |
| TSS | 2210 | 100 | 2310 |
| TZn | 0.48 | 0.04 | 0.52 |
| Analyte | West Edge | Alumni Center | Avg. | Solids | Water |
|---|---|---|---|---|---|
| Ca | .19 | 0.27 | 0.23 | – | 0.02 |
| Cu | 0.03 | 0.06 | 0.05 | 0.00 | 0.00 |
| Hardness | 1.10 | 1.42 | 1.26 | – | 0.11 |
| Mg | 0.15 | 0.18 | 0.17 | – | 0.00 |
| NH₄ | 0.10 | 0.38 | 0.24 | 0.04 | 0.02 |
| NO₂ | 0.00 | 0.01 | 0.00 | 0.00 | 0.00 |
| NO₃-N | 0.02 | 0.02 | 0.02 | 0.00 | 0.00 |
| ortho-P | 0.01 | 0.02 | 0.01 | 0.00 | 0.00 |
| TKN | 0.58 | 0.95 | 0.77 | 0.01 | 0.04 |
| TN | 0.60 | 0.96 | 0.78 | 0.01 | 0.04 |
| TP | 0.26 | 1.99 | 1.12 | 0.01 | 0.00 |
| TSS | 1253 | 3376 | 2310 | 0.00 | 0.75 |
| TZn | 0.05 | 0.99 | 0.52 | 0.00 | 0.00 |